How to improve your operations and processes with iAuditor data
iAuditor by SafetyCulture Tips | Tips & Tricks | By | 23 Jan 2020 | 3 minute read

Do you want to improve your workplace safety, quality, and operations without second-guessing yourself? It’s time to take your iAuditor analytics and turn them into actionable insights that you can use to drive improvement in your workplace.
With analytics at your fingertips, you can track trends and patterns to determine problem areas and top-performing areas to answer questions like:
- What are we doing?
- How are we doing?
- What do we need to improve on?
Jump right in to see the top analytics dashboards in iAuditor and learn how you can use them to influence positive change in your organization with the data to back decisions up.
Address problem areas by acting on failed items
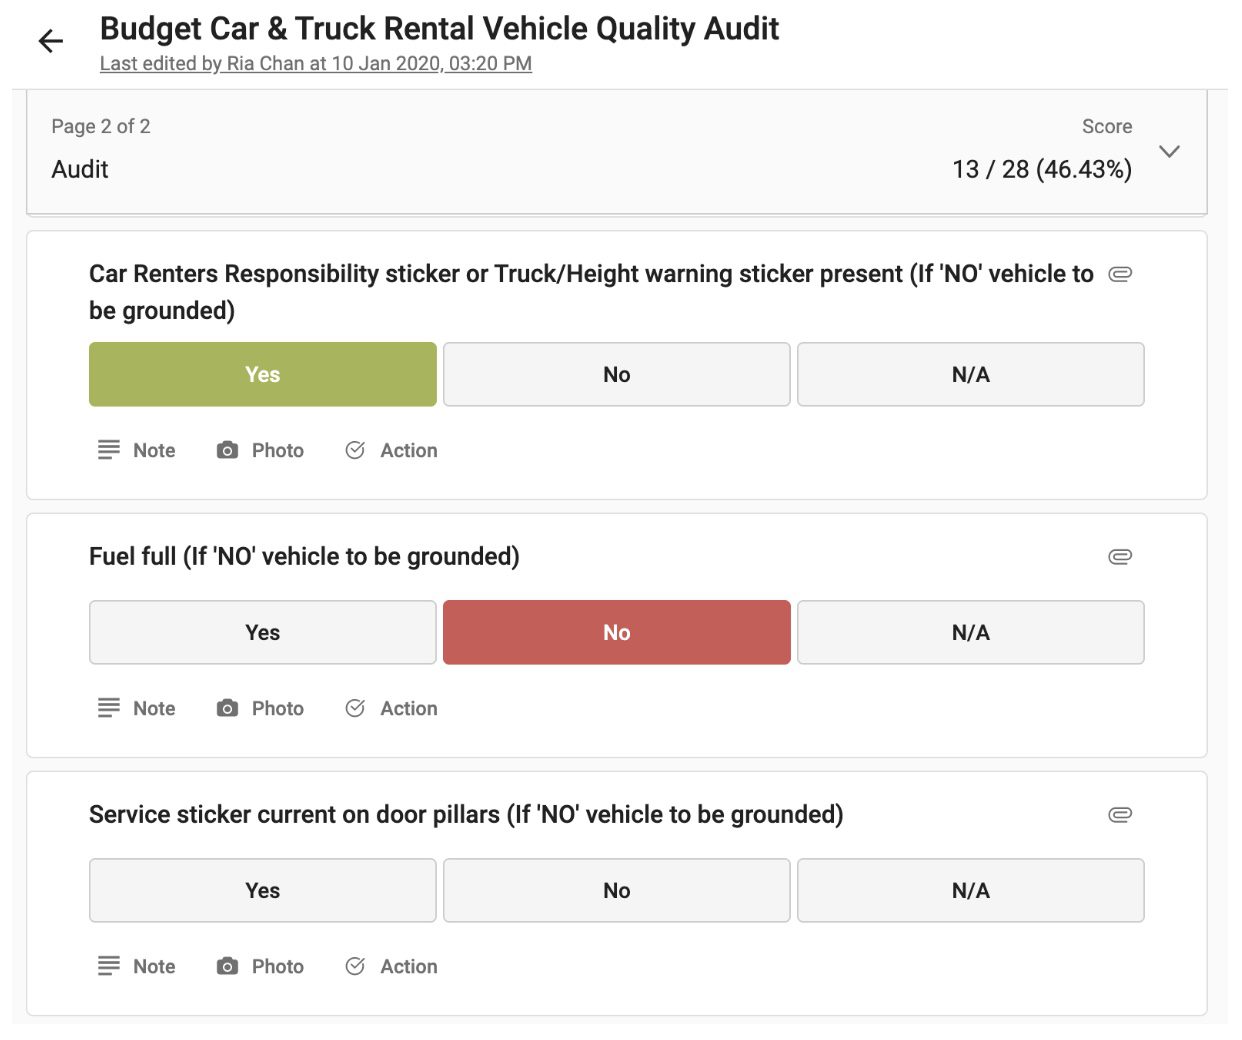
Picture this scenario: you look after a car rental company, and you’ve been noticing that more and more cars aren’t being fully refueled on return.
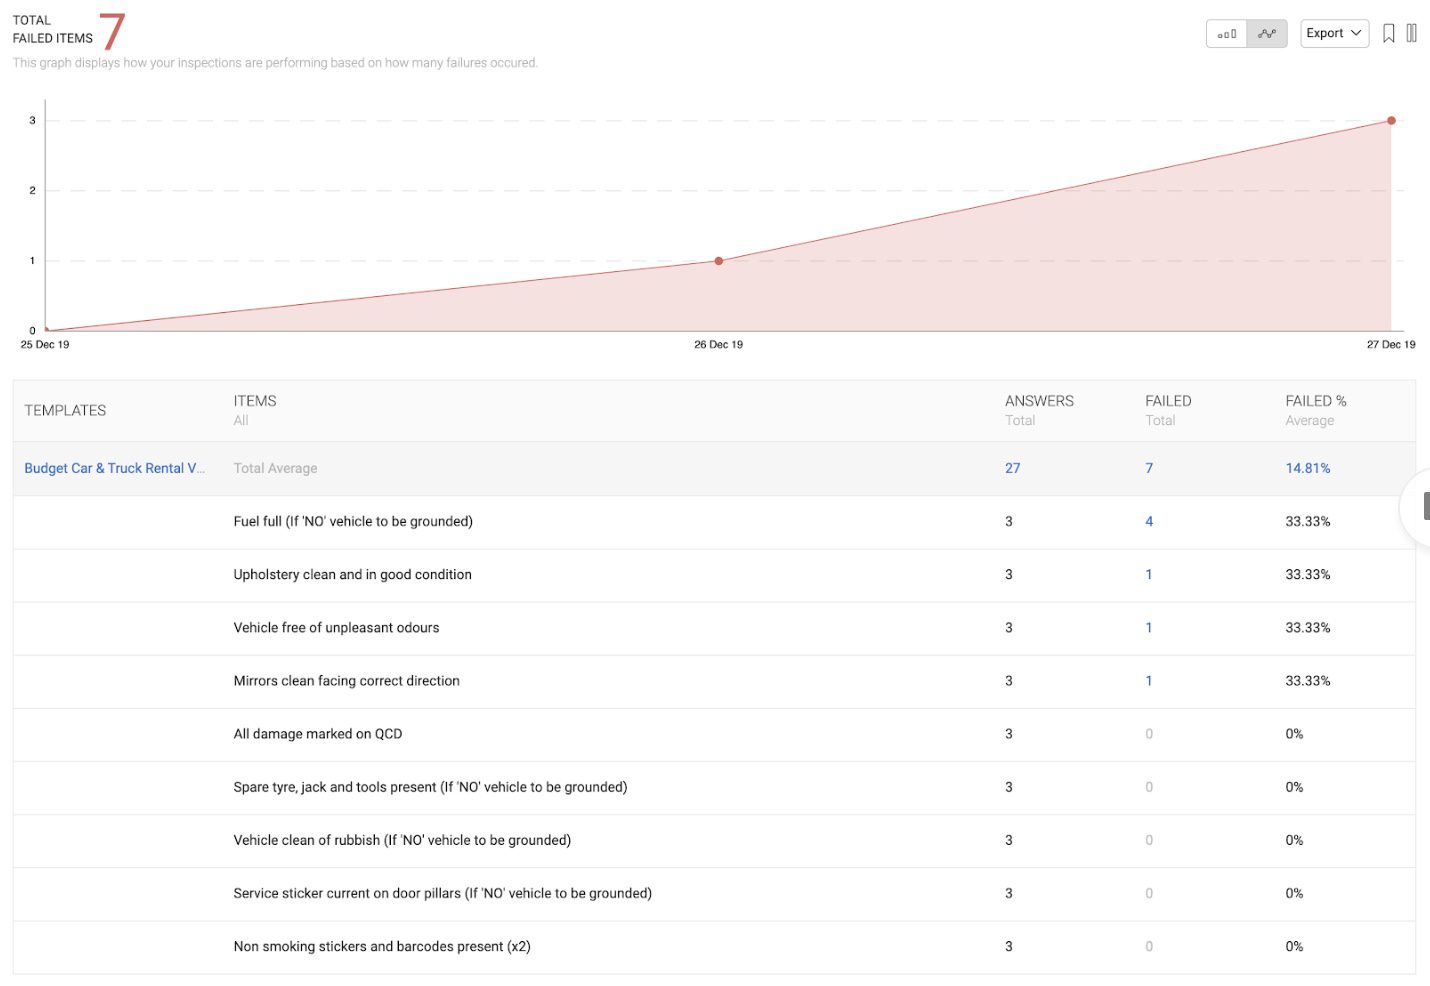
In the failed items dashboard, you’ll be able to see all items in your inspections that have been marked as failed. In this case, every time an employee answers the Full fuel question as No, it’ll mark it as a failed item inside iAuditor.
The failed items section can help you answer questions like: what needs to be looked at right now? Is anything preventing the business from running as usual? Are there safety hazards? Broken items? Or issues that are slowing things down?
Without a full tank of gas, revenue would be lost because rental cars would have to be grounded until they can be refueled and your company would have to cover the cost of extra petrol.
Once you understand what’s not working in your business, you can start to think about how you can influence the outcome.
How do you get more customers to return their rental cars with a full petrol tank? Can you communicate rules to customers better? At the extreme level, can you punish drivers who keep doing the wrong thing?
Monitor your problem areas by going to your analytics dashboard, and then review your failed items dashboard. You’ll see a list of the most common failed items and how many times the failures occurred. Here’s how you can start making data-driven decisions with the dashboard:
- Understand. Drill deep by clicking into specific items and look for attached photos and notes to get a better understanding of the problem.
- Pick out trends and patterns. Next, look at common factors present in all the failures to determine why it keeps happening. Do you notice that failed refueled cars tend to occur at specific car rental branches over others?
- Take action. Decide on how you want to address the problem. If it’s not a universal problem, it could be worth conducting staff training in that branch to improve how staff communicate to customers or implement a process on assigning refuels with actions.
- Track progress. Keep an eye on the failed item you are trying to fix. Over time, you’ll notice whether the strategies you’ve set are resulting in fewer failed items.
Create a big impact by zooming into single item scores
When there are so many moving parts of an organization, sometimes it’s easy to get distracted on something you think is a big issue, when you can drive improvements by honing into one area instead.
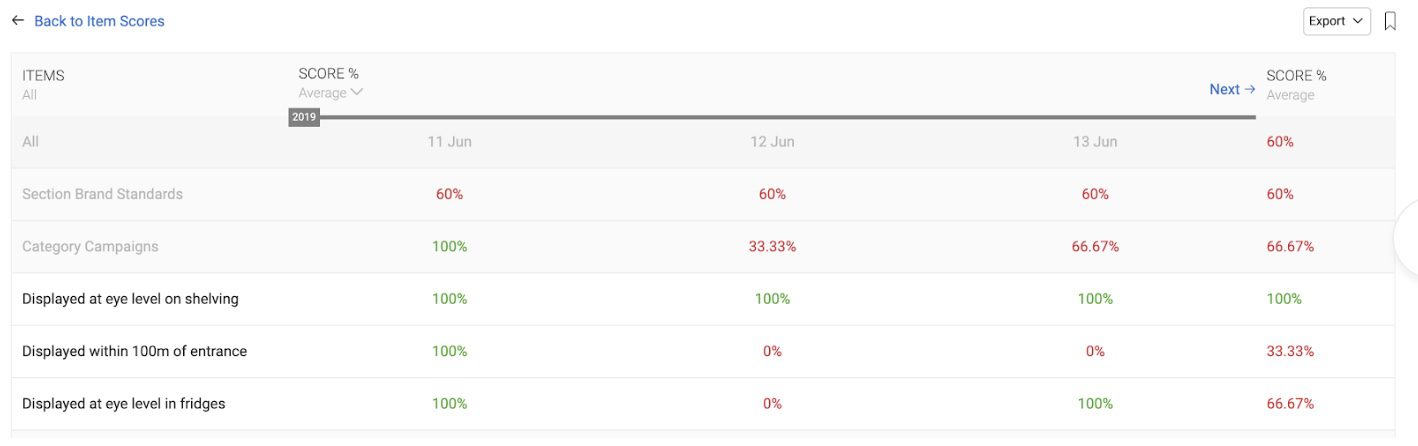
Let’s say you oversee a number of liquor stores, and you’ve recently signed a deal with a wine company to showcase their line of alcohol in prime real estate: on an eye level shelf at the entrance of the shop.
By equipping your staff with a brand standards check you can keep an eye on the prime real estate around your stores without being there and share the data with the wine company.
When things go awry, you can assign actions to staff so that inventory is in the right place, all the time.
Change starts with meaningful data
Your analytics will only be as good as the data you collect. The more inspections that you and your team conduct across different areas, the clearer the picture of your business will be.
By tracking your inspections analytics, you’ll be better placed to take action, improve team performance, and spot issues before they become a problem.
Ready to start improving safety, quality, and operations? Check out iAuditor Analytics.
Important Notice
The information contained in this article is general in nature and you should consider whether the information is appropriate to your specific needs. Legal and other matters referred to in this article are based on our interpretation of laws existing at the time and should not be relied on in place of professional advice. We are not responsible for the content of any site owned by a third party that may be linked to this article. SafetyCulture disclaims all liability (except for any liability which by law cannot be excluded) for any error, inaccuracy, or omission from the information contained in this article, any site linked to this article, and any loss or damage suffered by any person directly or indirectly through relying on this information.